Transform subscription data into business strategy
Reliable data, intuitive dashboards, actionable insights, and intelligent recommendations—everything you need to grow your brand at your fingertips.


Grow your business faster with data and insights collected from over 20,000 brands and 100 million subscribers on Recharge

Get the data you need, quickly—with dashboards that load near-instantaneously

Focus on the data you want with flexible filters and display controls
Understand what drives your business forward
Power subscriptions growth with insights from your data—and data from over 20,000 brands on Recharge
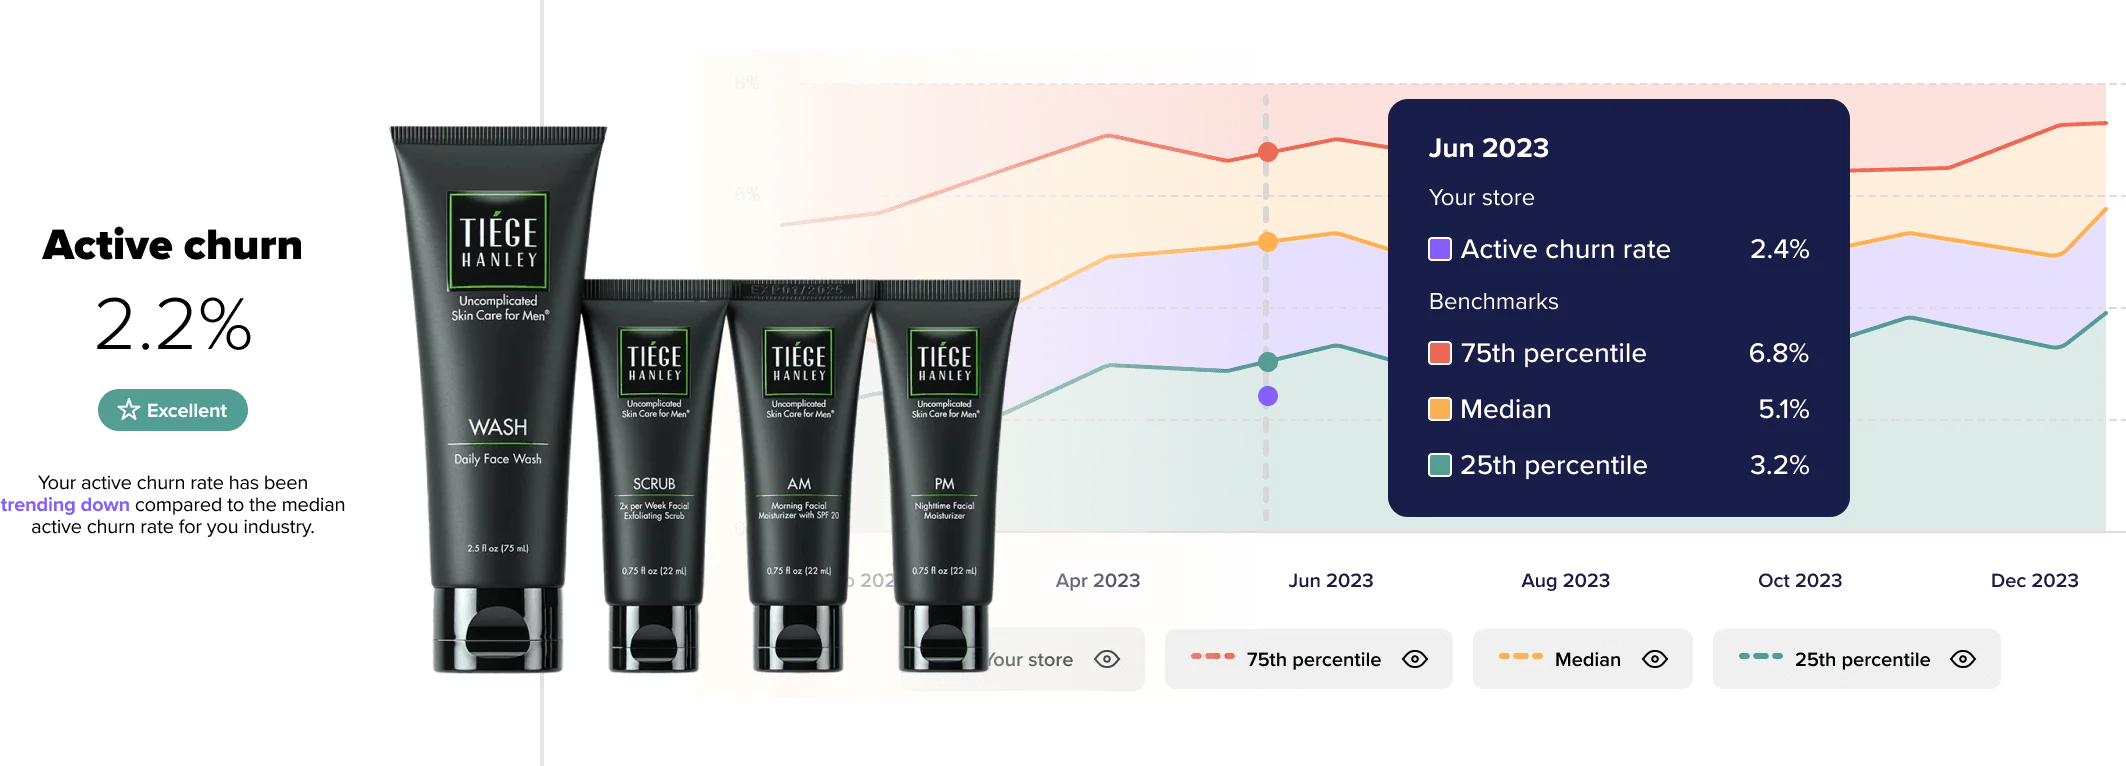
Contextualize your performance with Benchmarks
Compare your KPIs to brands like yours and understand how your performance measures up.
Visualize trends in performance over time
Track your brand’s performance over time to identify trends in growth and retention, and stay informed about industry-wide trends.
Optimize your performance
Discover opportunities to improve with data-backed recommendations.
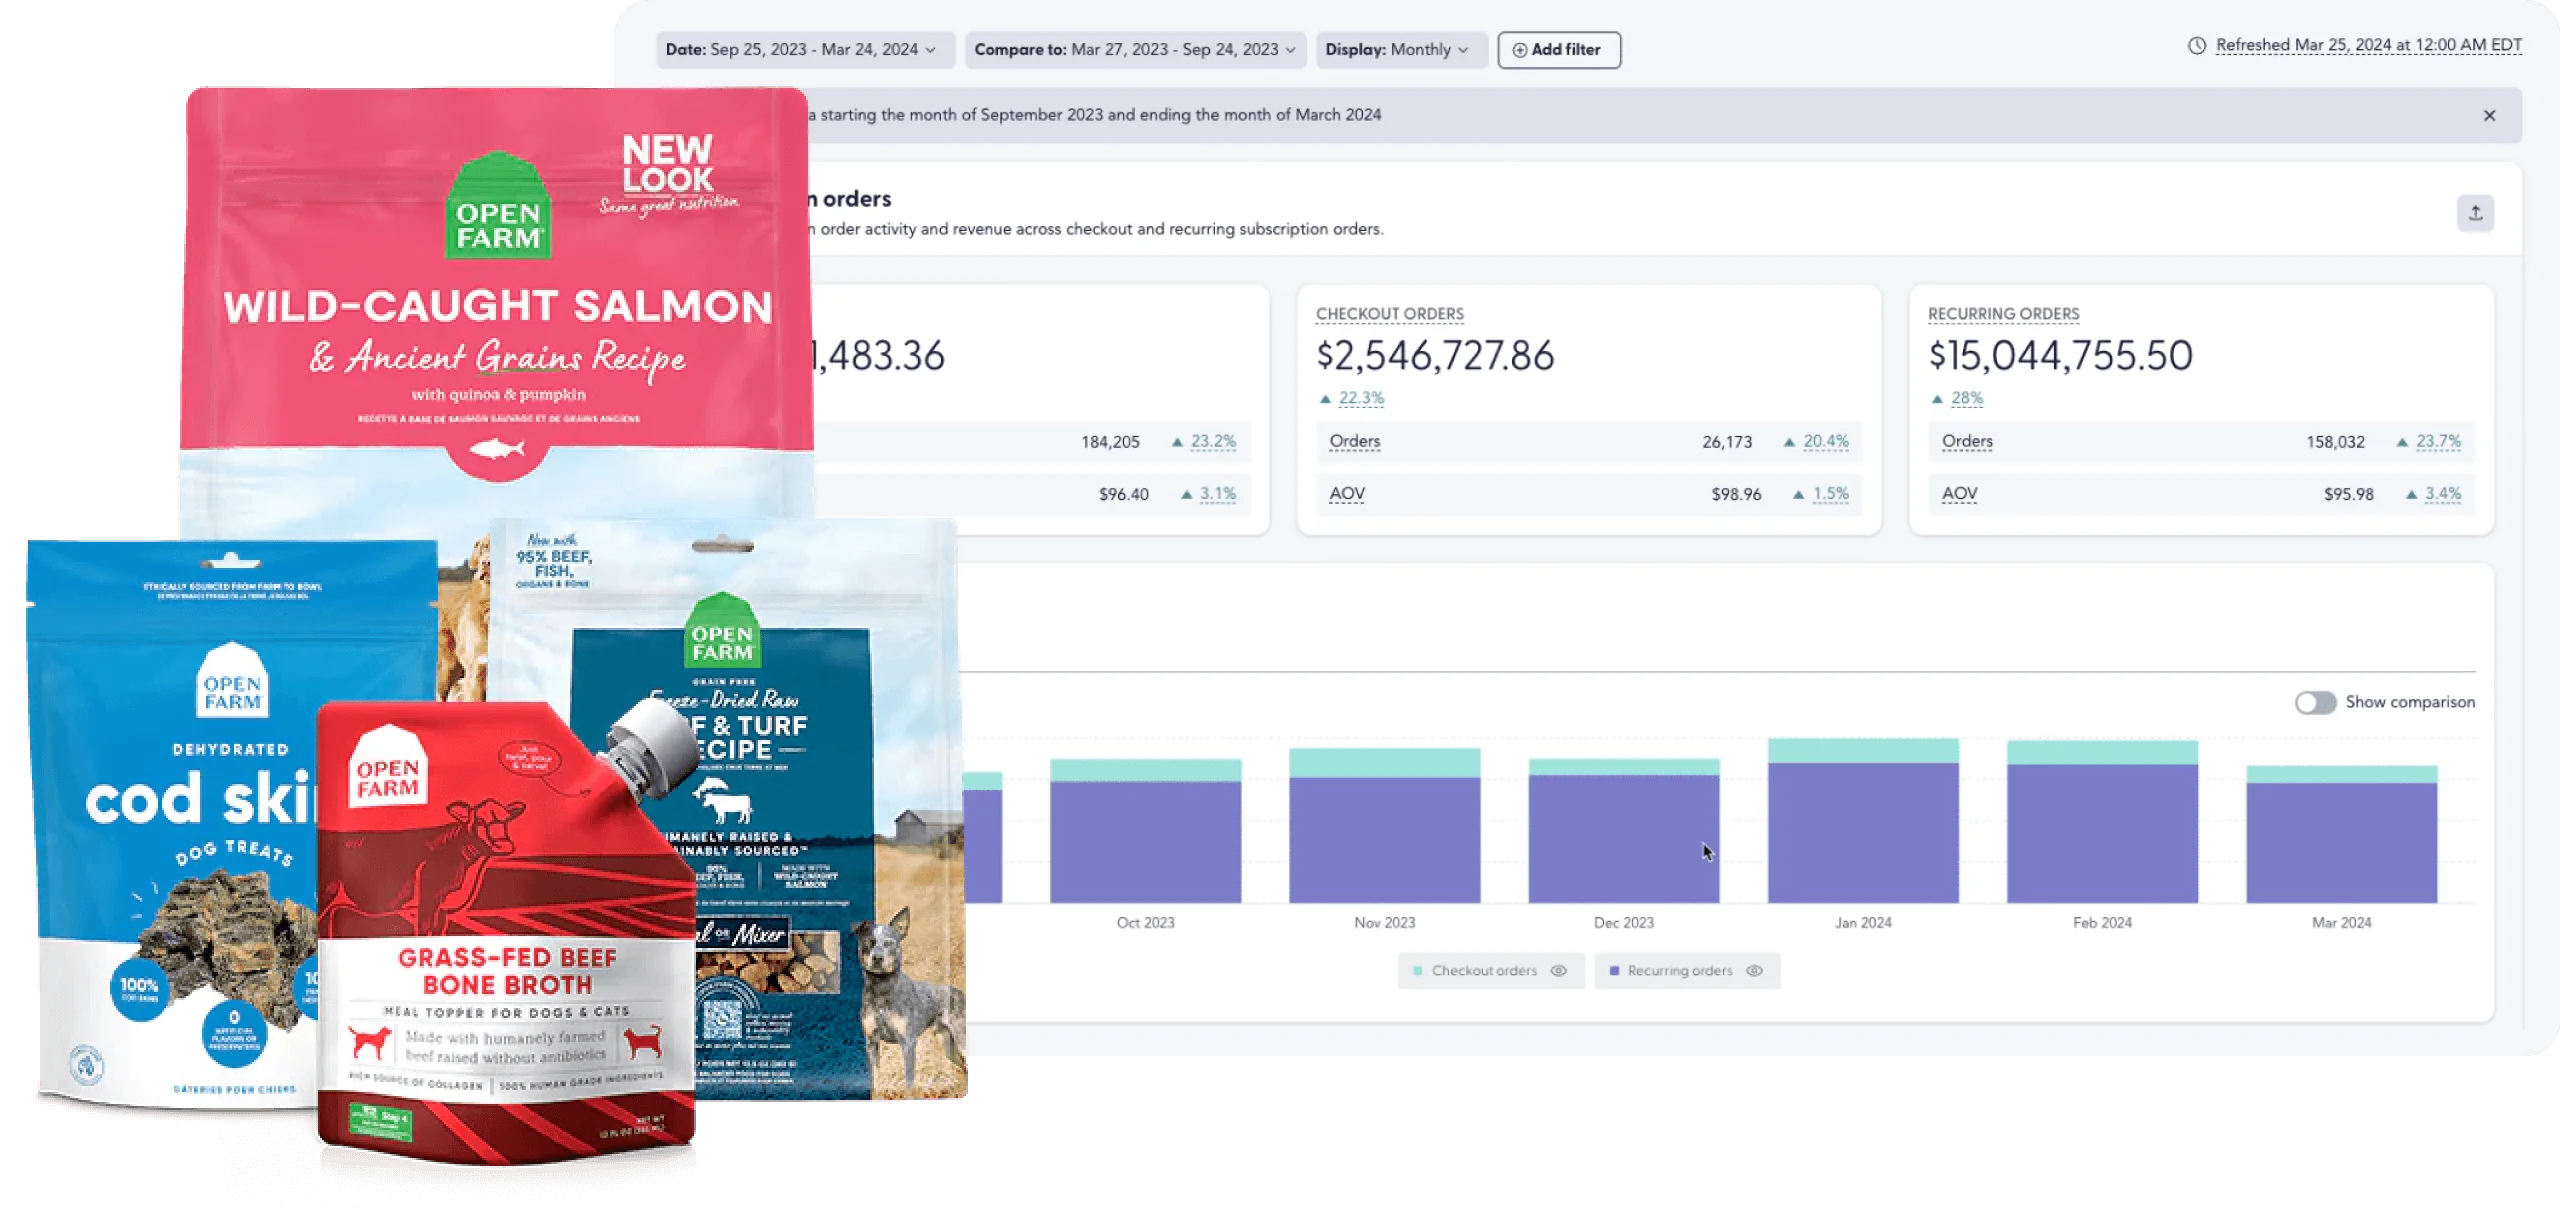
Make decisions faster with all your key metrics in one place
Gain a unified view of the data that impacts your day-to-day.
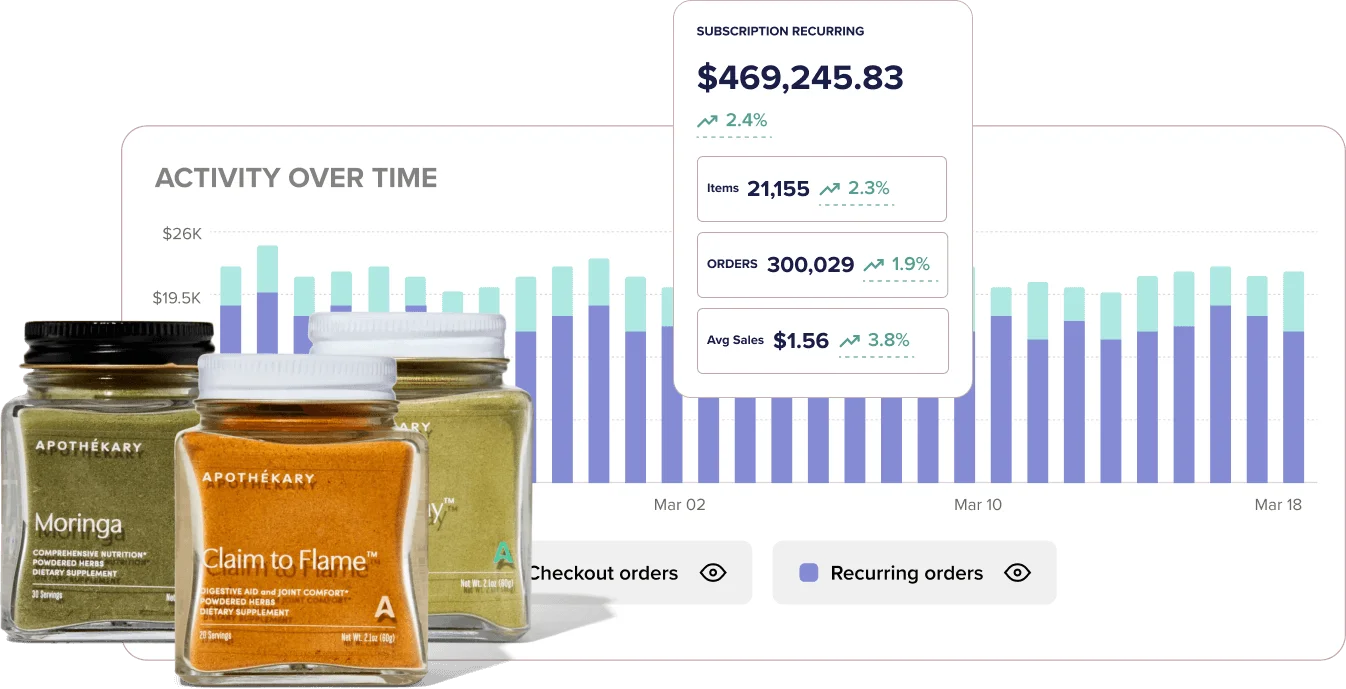
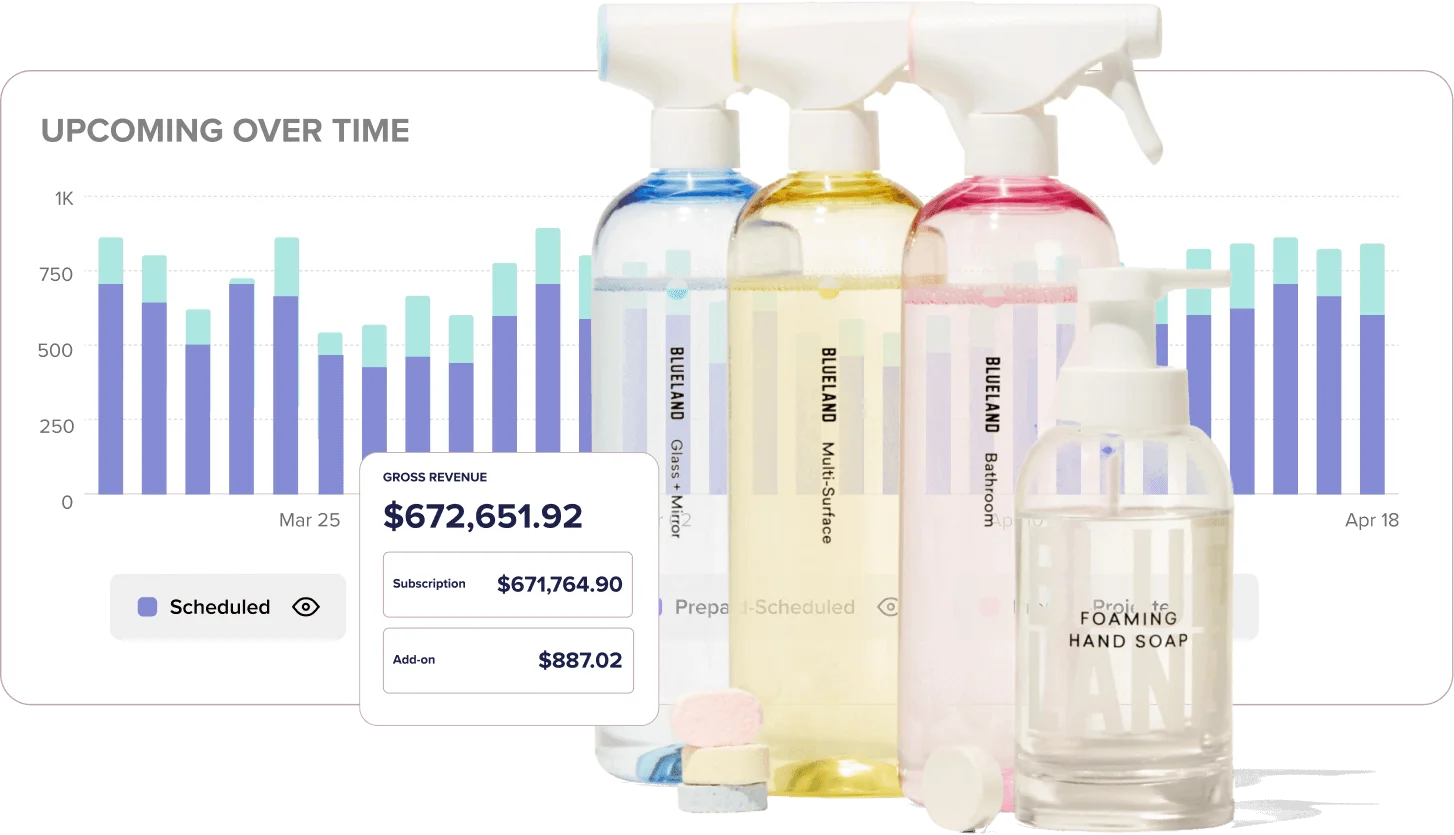
Know how much revenue your subscription sales are driving.
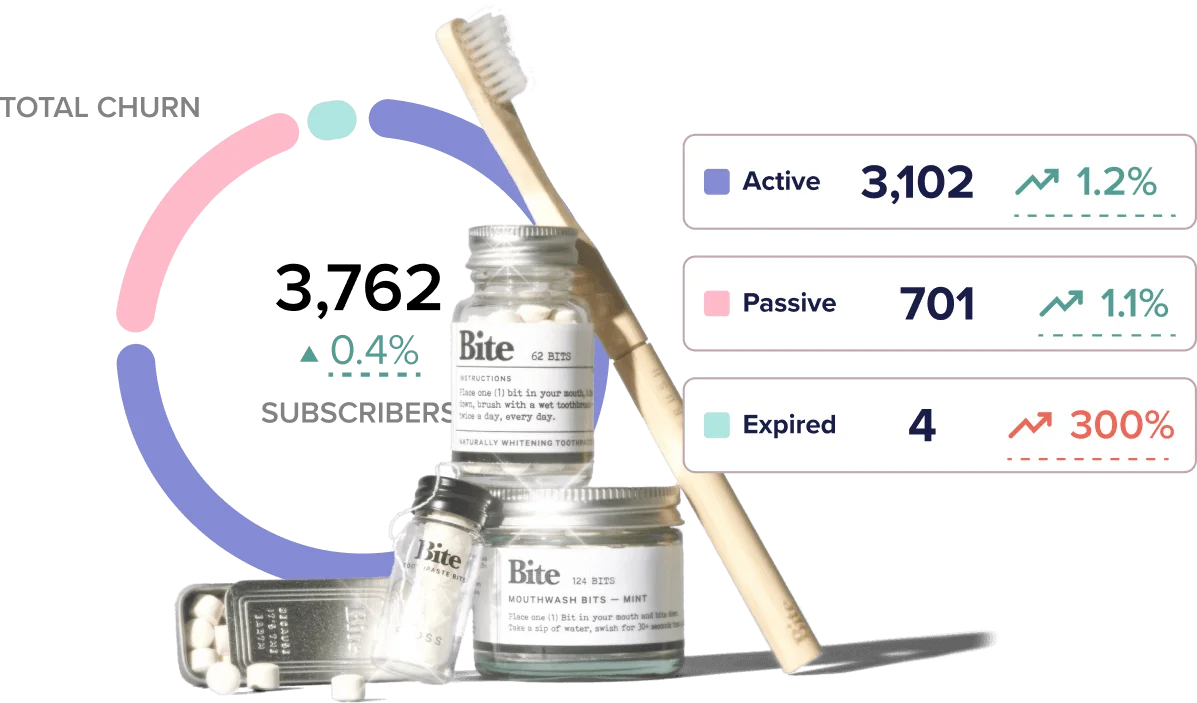
Understand trends in growth and retention among your subscribers and subscriptions.
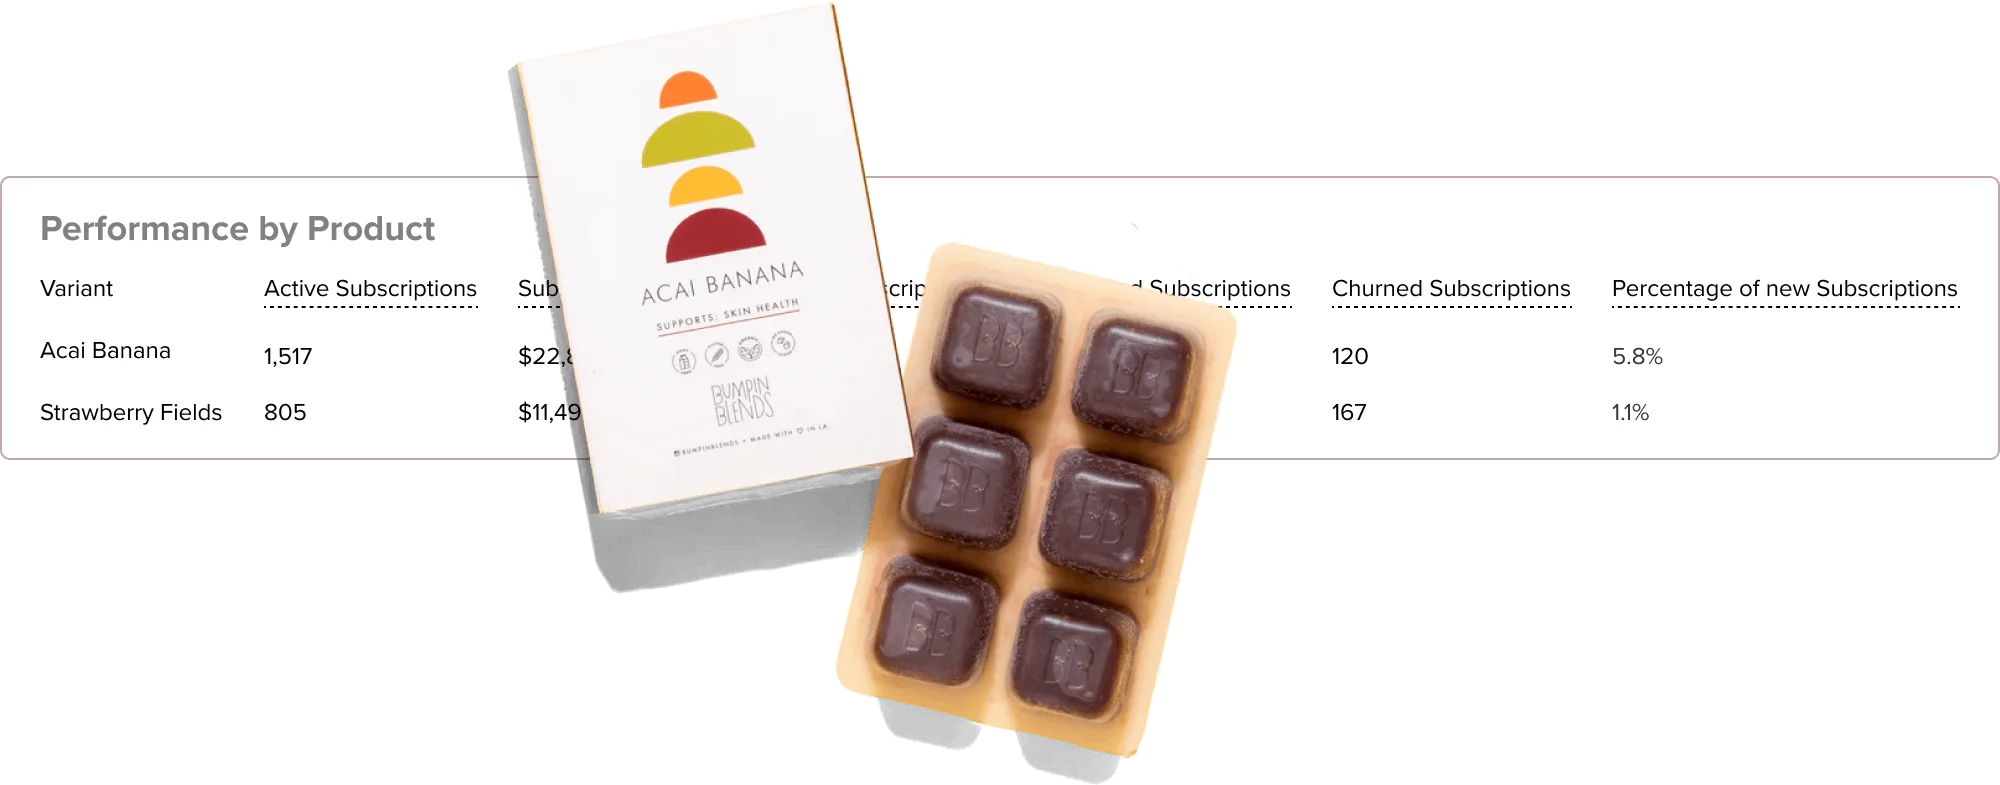
Learn which products and variants are most successful.
Project future revenue, anticipate inventory needs, and predict your subscription program’s performance over time.
Uncover your next step with insights into the customer journey
Inform every decision with data that identifies your most valuable customers moments, tactics, and more.
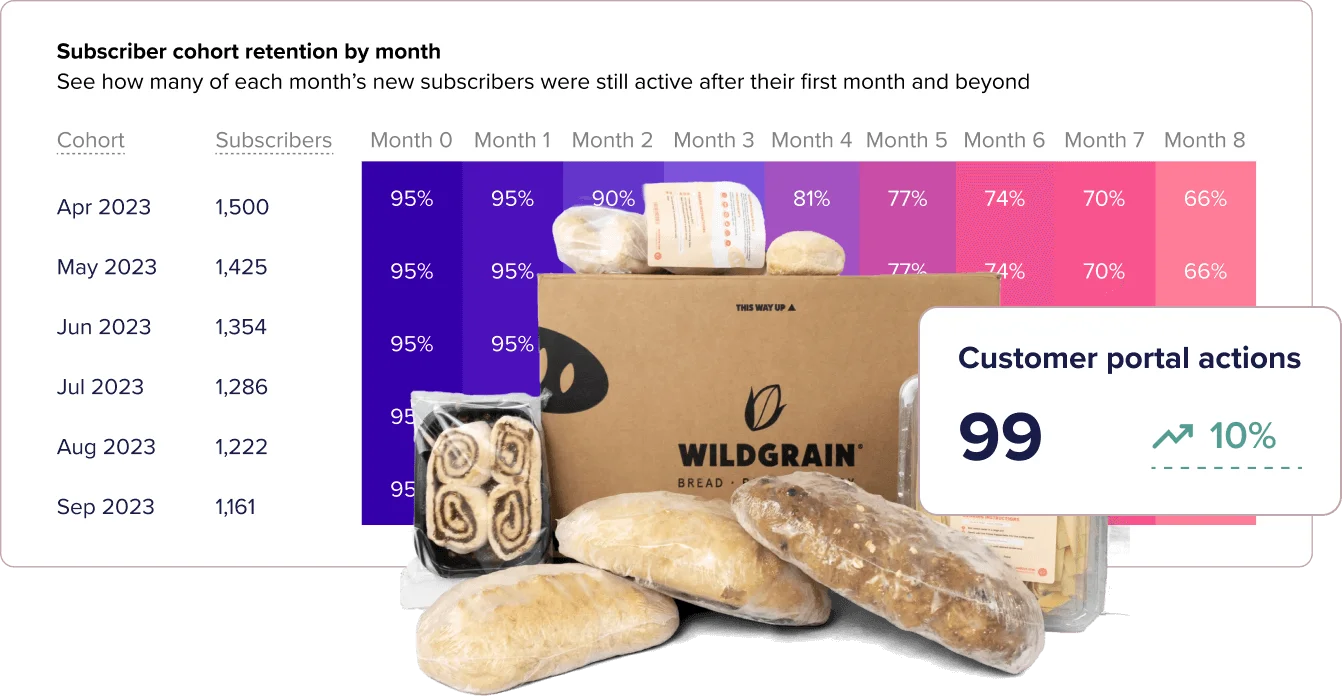
Dig deeper into your customers’ behaviors, from the actions they take to manage their subscriptions to when they’re most likely to churn, and pinpoint the right moments for engagement.
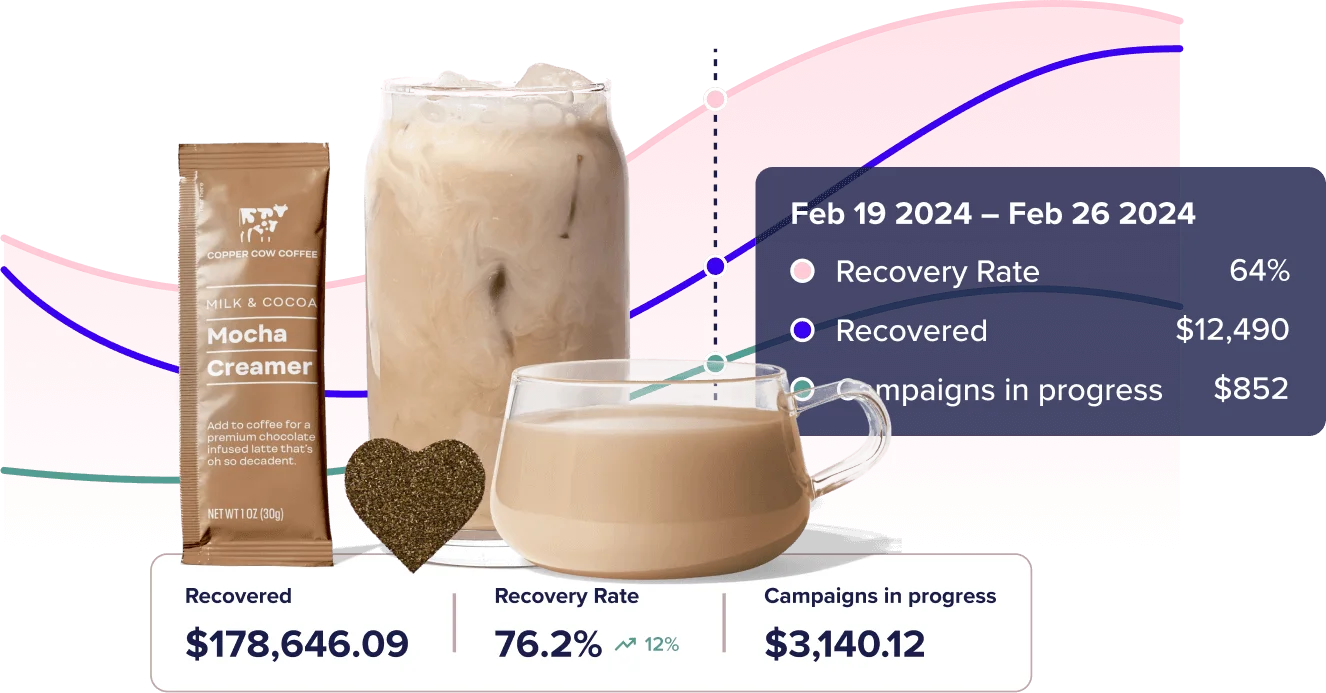
Discover which tactics are meaningfully contributing to your goals—from discounted upsells, to cancelation prevention offers, to free gifts—and tailor subscriber experiences to maximize the value of each customer.
Start making better decisions with Recharge